././@PaxHeader��������������������������������������������������������������������������������������0000000�0000000�0000000�00000000034�00000000000�010212� x����������������������������������������������������������������������������������������������������ustar�00�������������������������������������������������������������������������������������������������������������������������������������������������������������������������������������������������������������������������������������������������������28 mtime=1711671273.6600225
����������������������������������������������������������������������������������������������������������������������������������������������������������������������������������������������������������������������������������������������������������������������������������������������������������������������������������������������������������������������������������������������������������������������������������������������������������������������������������������������������ixbrl-viewer-1.4.22/��������������������������������������������������������������������������������0000755�0001751�0000177�00000000000�14601403752�013626� 5����������������������������������������������������������������������������������������������������ustar�00runner��������������������������docker�����������������������������������������������������������������������������������������������������������������������������������������������������������������������������������������������������������������././@PaxHeader��������������������������������������������������������������������������������������0000000�0000000�0000000�00000000026�00000000000�010213� x����������������������������������������������������������������������������������������������������ustar�00�������������������������������������������������������������������������������������������������������������������������������������������������������������������������������������������������������������������������������������������������������22 mtime=1711671226.0
����������������������������������������������������������������������������������������������������������������������������������������������������������������������������������������������������������������������������������������������������������������������������������������������������������������������������������������������������������������������������������������������������������������������������������������������������������������������������������������������������������ixbrl-viewer-1.4.22/.babelrc������������������������������������������������������������������������0000644�0001751�0000177�00000000136�14601403672�015222� 0����������������������������������������������������������������������������������������������������ustar�00runner��������������������������docker�����������������������������������������������������������������������������������������������������������������������������������������������������������������������������������������������������������������{
"env": {
"test": {
"plugins": ["transform-es2015-modules-commonjs"]
}
}
}
����������������������������������������������������������������������������������������������������������������������������������������������������������������������������������������������������������������������������������������������������������������������������������������������������������������������������������������������������������������������������������������������������������������������������������././@PaxHeader��������������������������������������������������������������������������������������0000000�0000000�0000000�00000000033�00000000000�010211� x����������������������������������������������������������������������������������������������������ustar�00�������������������������������������������������������������������������������������������������������������������������������������������������������������������������������������������������������������������������������������������������������27 mtime=1711671273.600023
�����������������������������������������������������������������������������������������������������������������������������������������������������������������������������������������������������������������������������������������������������������������������������������������������������������������������������������������������������������������������������������������������������������������������������������������������������������������������������������������������������ixbrl-viewer-1.4.22/.github/������������������������������������������������������������������������0000755�0001751�0000177�00000000000�14601403752�015166� 5����������������������������������������������������������������������������������������������������ustar�00runner��������������������������docker�����������������������������������������������������������������������������������������������������������������������������������������������������������������������������������������������������������������././@PaxHeader��������������������������������������������������������������������������������������0000000�0000000�0000000�00000000033�00000000000�010211� x����������������������������������������������������������������������������������������������������ustar�00�������������������������������������������������������������������������������������������������������������������������������������������������������������������������������������������������������������������������������������������������������27 mtime=1711671273.600023
�����������������������������������������������������������������������������������������������������������������������������������������������������������������������������������������������������������������������������������������������������������������������������������������������������������������������������������������������������������������������������������������������������������������������������������������������������������������������������������������������������ixbrl-viewer-1.4.22/.github/ISSUE_TEMPLATE/���������������������������������������������������������0000755�0001751�0000177�00000000000�14601403752�017351� 5����������������������������������������������������������������������������������������������������ustar�00runner��������������������������docker�����������������������������������������������������������������������������������������������������������������������������������������������������������������������������������������������������������������././@PaxHeader��������������������������������������������������������������������������������������0000000�0000000�0000000�00000000026�00000000000�010213� x����������������������������������������������������������������������������������������������������ustar�00�������������������������������������������������������������������������������������������������������������������������������������������������������������������������������������������������������������������������������������������������������22 mtime=1711671226.0
����������������������������������������������������������������������������������������������������������������������������������������������������������������������������������������������������������������������������������������������������������������������������������������������������������������������������������������������������������������������������������������������������������������������������������������������������������������������������������������������������������ixbrl-viewer-1.4.22/.github/ISSUE_TEMPLATE/bug.yml��������������������������������������������������0000644�0001751�0000177�00000003521�14601403672�020653� 0����������������������������������������������������������������������������������������������������ustar�00runner��������������������������docker�����������������������������������������������������������������������������������������������������������������������������������������������������������������������������������������������������������������name: Bug Report
description: File a bug report.
title: "[BUG] "
labels: ["bug"]
body:
- type: markdown
attributes:
value: |
Thanks for taking the time to fill out this bug report!
ixbrl-viewer is browser based product which means it can vary between browsers.
Providing details on how you're using ixbrl-viewer will significantly decrease the amount of time to figure out what's wrong.
Please try to provide a document that reproduces the issue as well as a screenshot.
- type: textarea
id: what-happened
attributes:
label: What happened?
description: And what did you expect to happen?
validations:
required: true
- type: input
id: version
attributes:
label: Version
description: |
What version of ixbrl-viewer are you using?
- In the browser, right click + inspect
- Scroll to the bottom of the `` tag and find the script tag containing the version eg: ``
placeholder: e.g. 1.1.43
validations:
required: true
- type: dropdown
id: browsers
attributes:
label: With which browsers are you experiencing the bug?
multiple: true
options:
- Firefox
- Chrome
- Safari
- Microsoft Edge
validations:
required: true
- type: textarea
id: documents
attributes:
label: Documents
description: If possible, please attach any documents that cause the bug.
placeholder: Drag and drop documents here.
- type: textarea
id: screenshots
attributes:
label: Screenshots
description: If possible, please attach screenshots of the bug.
placeholder: Drag and drop screenshots here.
�������������������������������������������������������������������������������������������������������������������������������������������������������������������������������././@PaxHeader��������������������������������������������������������������������������������������0000000�0000000�0000000�00000000026�00000000000�010213� x����������������������������������������������������������������������������������������������������ustar�00�������������������������������������������������������������������������������������������������������������������������������������������������������������������������������������������������������������������������������������������������������22 mtime=1711671226.0
����������������������������������������������������������������������������������������������������������������������������������������������������������������������������������������������������������������������������������������������������������������������������������������������������������������������������������������������������������������������������������������������������������������������������������������������������������������������������������������������������������ixbrl-viewer-1.4.22/.github/ISSUE_TEMPLATE/config.yml�����������������������������������������������0000644�0001751�0000177�00000000034�14601403672�021337� 0����������������������������������������������������������������������������������������������������ustar�00runner��������������������������docker�����������������������������������������������������������������������������������������������������������������������������������������������������������������������������������������������������������������blank_issues_enabled: false
����������������������������������������������������������������������������������������������������������������������������������������������������������������������������������������������������������������������������������������������������������������������������������������������������������������������������������������������������������������������������������������������������������������������������������������������������������������������������������������������������././@PaxHeader��������������������������������������������������������������������������������������0000000�0000000�0000000�00000000026�00000000000�010213� x����������������������������������������������������������������������������������������������������ustar�00�������������������������������������������������������������������������������������������������������������������������������������������������������������������������������������������������������������������������������������������������������22 mtime=1711671226.0
����������������������������������������������������������������������������������������������������������������������������������������������������������������������������������������������������������������������������������������������������������������������������������������������������������������������������������������������������������������������������������������������������������������������������������������������������������������������������������������������������������ixbrl-viewer-1.4.22/.github/ISSUE_TEMPLATE/questions.yml��������������������������������������������0000644�0001751�0000177�00000000434�14601403672�022130� 0����������������������������������������������������������������������������������������������������ustar�00runner��������������������������docker�����������������������������������������������������������������������������������������������������������������������������������������������������������������������������������������������������������������name: Question
description: Ask a question.
title: "[QUESTION] "
labels: ["question"]
body:
- type: textarea
id: change
attributes:
label: What question do you have? Be sure to check the wiki to see if it has been answered before
validations:
required: true
������������������������������������������������������������������������������������������������������������������������������������������������������������������������������������������������������������������������������������././@PaxHeader��������������������������������������������������������������������������������������0000000�0000000�0000000�00000000026�00000000000�010213� x����������������������������������������������������������������������������������������������������ustar�00�������������������������������������������������������������������������������������������������������������������������������������������������������������������������������������������������������������������������������������������������������22 mtime=1711671226.0
����������������������������������������������������������������������������������������������������������������������������������������������������������������������������������������������������������������������������������������������������������������������������������������������������������������������������������������������������������������������������������������������������������������������������������������������������������������������������������������������������������ixbrl-viewer-1.4.22/.github/ISSUE_TEMPLATE/request.yml����������������������������������������������0000644�0001751�0000177�00000000345�14601403672�021567� 0����������������������������������������������������������������������������������������������������ustar�00runner��������������������������docker�����������������������������������������������������������������������������������������������������������������������������������������������������������������������������������������������������������������name: Change Request
description: Suggest an idea.
title: "[REQUEST] "
labels: ["request"]
body:
- type: textarea
id: change
attributes:
label: What should we change and why?
validations:
required: true
�������������������������������������������������������������������������������������������������������������������������������������������������������������������������������������������������������������������������������������������������������������������������������������������././@PaxHeader��������������������������������������������������������������������������������������0000000�0000000�0000000�00000000026�00000000000�010213� x����������������������������������������������������������������������������������������������������ustar�00�������������������������������������������������������������������������������������������������������������������������������������������������������������������������������������������������������������������������������������������������������22 mtime=1711671226.0
����������������������������������������������������������������������������������������������������������������������������������������������������������������������������������������������������������������������������������������������������������������������������������������������������������������������������������������������������������������������������������������������������������������������������������������������������������������������������������������������������������ixbrl-viewer-1.4.22/.github/PULL_REQUEST_TEMPLATE.md������������������������������������������������0000644�0001751�0000177�00000000164�14601403672�020771� 0����������������������������������������������������������������������������������������������������ustar�00runner��������������������������docker�����������������������������������������������������������������������������������������������������������������������������������������������������������������������������������������������������������������#### Reason for change
#### Description of change
#### Steps to Test
**review**:
@Arelle/arelle
@paulwarren-wk
������������������������������������������������������������������������������������������������������������������������������������������������������������������������������������������������������������������������������������������������������������������������������������������������������������������������������������������������������������������������������������������������������������././@PaxHeader��������������������������������������������������������������������������������������0000000�0000000�0000000�00000000026�00000000000�010213� x����������������������������������������������������������������������������������������������������ustar�00�������������������������������������������������������������������������������������������������������������������������������������������������������������������������������������������������������������������������������������������������������22 mtime=1711671226.0
����������������������������������������������������������������������������������������������������������������������������������������������������������������������������������������������������������������������������������������������������������������������������������������������������������������������������������������������������������������������������������������������������������������������������������������������������������������������������������������������������������ixbrl-viewer-1.4.22/.github/dependabot.yml����������������������������������������������������������0000644�0001751�0000177�00000002335�14601403672�020022� 0����������������������������������������������������������������������������������������������������ustar�00runner��������������������������docker�����������������������������������������������������������������������������������������������������������������������������������������������������������������������������������������������������������������version: 2
updates:
- package-ecosystem: "github-actions"
directory: "/"
schedule:
interval: weekly
groups:
github-action-dependencies:
patterns:
- "*"
- package-ecosystem: npm
directory: "/"
schedule:
interval: weekly
allow:
- dependency-type: all
groups:
npm-dependencies:
patterns:
- "*"
exclude-patterns:
- "*jest*"
- "stylelint*"
jest:
patterns:
- "*jest*"
stylelint:
patterns:
- "stylelint*"
ignore:
- dependency-name: chart.js
versions:
- ">=3"
- dependency-name: css-loader
versions:
- ">=4"
- dependency-name: html-loader
versions:
- ">=1"
- dependency-name: i18next
versions:
- ">=21"
- dependency-name: less
versions:
- ">=4"
- dependency-name: less-loader
versions:
- ">=7"
- package-ecosystem: pip
directory: "/"
insecure-external-code-execution: allow
schedule:
interval: weekly
allow:
- dependency-type: all
groups:
pip-dependencies:
patterns:
- "*"
���������������������������������������������������������������������������������������������������������������������������������������������������������������������������������������������������������������������������������������������������������������������������������������������������././@PaxHeader��������������������������������������������������������������������������������������0000000�0000000�0000000�00000000026�00000000000�010213� x����������������������������������������������������������������������������������������������������ustar�00�������������������������������������������������������������������������������������������������������������������������������������������������������������������������������������������������������������������������������������������������������22 mtime=1711671226.0
����������������������������������������������������������������������������������������������������������������������������������������������������������������������������������������������������������������������������������������������������������������������������������������������������������������������������������������������������������������������������������������������������������������������������������������������������������������������������������������������������������ixbrl-viewer-1.4.22/.github/release-drafter.yml�����������������������������������������������������0000644�0001751�0000177�00000000600�14601403672�020753� 0����������������������������������������������������������������������������������������������������ustar�00runner��������������������������docker�����������������������������������������������������������������������������������������������������������������������������������������������������������������������������������������������������������������name-template: '$RESOLVED_VERSION'
tag-template: '$RESOLVED_VERSION'
categories:
- title: "⬆️ Dependencies"
collapse-after: 1
labels:
- "dependencies"
template: |
## What's Changed
$CHANGES
version-resolver:
major:
labels:
- 'major-release'
minor:
labels:
- 'minor-release'
patch:
labels:
- 'patch-release'
default: patch
��������������������������������������������������������������������������������������������������������������������������������././@PaxHeader��������������������������������������������������������������������������������������0000000�0000000�0000000�00000000033�00000000000�010211� x����������������������������������������������������������������������������������������������������ustar�00�������������������������������������������������������������������������������������������������������������������������������������������������������������������������������������������������������������������������������������������������������27 mtime=1711671273.604023
�����������������������������������������������������������������������������������������������������������������������������������������������������������������������������������������������������������������������������������������������������������������������������������������������������������������������������������������������������������������������������������������������������������������������������������������������������������������������������������������������������ixbrl-viewer-1.4.22/.github/workflows/��������������������������������������������������������������0000755�0001751�0000177�00000000000�14601403752�017223� 5����������������������������������������������������������������������������������������������������ustar�00runner��������������������������docker�����������������������������������������������������������������������������������������������������������������������������������������������������������������������������������������������������������������././@PaxHeader��������������������������������������������������������������������������������������0000000�0000000�0000000�00000000026�00000000000�010213� x����������������������������������������������������������������������������������������������������ustar�00�������������������������������������������������������������������������������������������������������������������������������������������������������������������������������������������������������������������������������������������������������22 mtime=1711671226.0
����������������������������������������������������������������������������������������������������������������������������������������������������������������������������������������������������������������������������������������������������������������������������������������������������������������������������������������������������������������������������������������������������������������������������������������������������������������������������������������������������������ixbrl-viewer-1.4.22/.github/workflows/node-tests.yml������������������������������������������������0000644�0001751�0000177�00000001366�14601403672�022042� 0����������������������������������������������������������������������������������������������������ustar�00runner��������������������������docker�����������������������������������������������������������������������������������������������������������������������������������������������������������������������������������������������������������������name: Run Node Unit Tests
on:
pull_request:
branches:
- master
workflow_call:
workflow_dispatch:
permissions: {}
jobs:
tests:
strategy:
fail-fast: false
matrix:
os:
- macos-12
- ubuntu-22.04
- windows-2022
node-version:
- '18'
- '20'
- '21'
runs-on: ${{ matrix.os }}
steps:
- uses: actions/checkout@v4.1.2
- uses: actions/setup-node@v4.0.2
with:
cache: 'npm'
check-latest: true
node-version: ${{ matrix.node-version }}
- name: Install dependencies
run: npm ci
- name: Lint with npm
run: npm run stylelint
- name: Test with npm
run: npm run test
��������������������������������������������������������������������������������������������������������������������������������������������������������������������������������������������������������������������������������������������������������������������������././@PaxHeader��������������������������������������������������������������������������������������0000000�0000000�0000000�00000000026�00000000000�010213� x����������������������������������������������������������������������������������������������������ustar�00�������������������������������������������������������������������������������������������������������������������������������������������������������������������������������������������������������������������������������������������������������22 mtime=1711671226.0
����������������������������������������������������������������������������������������������������������������������������������������������������������������������������������������������������������������������������������������������������������������������������������������������������������������������������������������������������������������������������������������������������������������������������������������������������������������������������������������������������������ixbrl-viewer-1.4.22/.github/workflows/npm-package.yml�����������������������������������������������0000644�0001751�0000177�00000005201�14601403672�022130� 0����������������������������������������������������������������������������������������������������ustar�00runner��������������������������docker�����������������������������������������������������������������������������������������������������������������������������������������������������������������������������������������������������������������name: Build and publish NPM package
on:
workflow_call:
inputs:
node_version:
default: '20'
description: 'Node version to use'
required: false
type: string
workflow_dispatch:
inputs:
node_version:
default: '20'
description: 'Node version to use'
required: true
type: string
permissions: {}
jobs:
build-package:
runs-on: ubuntu-22.04
steps:
- name: Checkout ixbrl-viewer
uses: actions/checkout@v4.1.2
with:
fetch-depth: 0 # npm run prod requires tags, sadly this is the only way to get them.
- name: Install Node.js
uses: actions/setup-node@v4.0.2
with:
cache: 'npm'
check-latest: true
node-version: ${{ inputs.node_version }}
- name: Install npm dependencies
run: npm ci
- name: Build ixbrlviewer.js
run: make prod
- name: Create npm package
run: |
npm config set git-tag-version=false
npm version $(git describe --tags)
npm pack
- name: Upload ixbrlviewer.js artifact
uses: actions/upload-artifact@v4.3.1
with:
name: ixbrlviewer.js
if-no-files-found: error
path: iXBRLViewerPlugin/viewer/dist/ixbrlviewer.js
- name: Upload npm artifact
uses: actions/upload-artifact@v4.3.1
with:
name: npm package
if-no-files-found: error
path: ixbrl-viewer-*.tgz
publish-package:
needs: build-package
environment: release
permissions:
contents: write
runs-on: ubuntu-22.04
if: startsWith(github.ref, 'refs/tags')
steps:
- name: Install Node.js
uses: actions/setup-node@v4.0.2
with:
check-latest: true
node-version: ${{ inputs.node_version }}
registry-url: 'https://registry.npmjs.org' # Must explicitly set this for NODE_AUTH_TOKEN to work below
- name: Download ixbrlviewer.js artifact
uses: actions/download-artifact@v4.1.4
with:
name: ixbrlviewer.js
- name: Download npm artifact
uses: actions/download-artifact@v4.1.4
with:
name: npm package
- name: Publish with npm
if: startsWith(github.ref, 'refs/tags')
env:
NODE_AUTH_TOKEN: ${{ secrets.NPM_TOKEN }}
NPM_CONFIG_DRY_RUN: ${{ github.repository != 'Arelle/ixbrl-viewer' }}
run: npm publish ixbrl-viewer-*.tgz --access public
- name: Upload release artifacts
uses: softprops/action-gh-release@v2.0.4
with:
fail_on_unmatched_files: true
files: './*'
�����������������������������������������������������������������������������������������������������������������������������������������������������������������������������������������������������������������������������������������������������������������������������������������������������������������������������������������������������������������������������������������������././@PaxHeader��������������������������������������������������������������������������������������0000000�0000000�0000000�00000000026�00000000000�010213� x����������������������������������������������������������������������������������������������������ustar�00�������������������������������������������������������������������������������������������������������������������������������������������������������������������������������������������������������������������������������������������������������22 mtime=1711671226.0
����������������������������������������������������������������������������������������������������������������������������������������������������������������������������������������������������������������������������������������������������������������������������������������������������������������������������������������������������������������������������������������������������������������������������������������������������������������������������������������������������������ixbrl-viewer-1.4.22/.github/workflows/puppeteer.yml�������������������������������������������������0000644�0001751�0000177�00000003277�14601403672�021771� 0����������������������������������������������������������������������������������������������������ustar�00runner��������������������������docker�����������������������������������������������������������������������������������������������������������������������������������������������������������������������������������������������������������������name: Run Puppeteer Tests
on:
pull_request:
branches:
- master
workflow_dispatch:
permissions: {}
jobs:
tests:
strategy:
fail-fast: false
matrix:
os:
- macos-12
- ubuntu-22.04
- windows-2022
node-version:
- '18'
- '20'
- '21'
python-version:
- '3.12'
runs-on: ${{ matrix.os }}
steps:
- uses: actions/checkout@v4.1.2
with:
fetch-depth: 0 # npm run prod requires tags, sadly this is the only way to get them.
- uses: actions/setup-node@v4.0.2
with:
cache: 'npm'
check-latest: true
node-version: ${{ matrix.node-version }}
- name: Install Python 3
uses: actions/setup-python@v5.0.0
with:
cache: 'pip'
cache-dependency-path: '**/pyproject.toml'
check-latest: true
python-version: ${{ matrix.python-version }}
- name: Install Dependencies
run: npm ci
- name: Install Arelle
run: pip install .[arelle]
- name: Build viewer js
run: make prod
- name: Generate test viewers
shell: bash
run: ./tests/puppeteer/tools/generate.sh
- name: Serve the generated files
shell: bash
run: npx http-server . &> tests/puppeteer/artifacts/http_server.log &
- name: Run puppeteer tests
run: npm run test:puppeteer
- uses: actions/upload-artifact@v4.3.1
if: failure()
with:
name: ${{ github.run_id }}.${{ github.run_attempt }}_${{ matrix.os }}_${{ matrix.node-version }}_${{ matrix.python-version }}_artifacts
path: tests/puppeteer/artifacts/
���������������������������������������������������������������������������������������������������������������������������������������������������������������������������������������������������������������������������������������������������������������������������������������������������������������������������������././@PaxHeader��������������������������������������������������������������������������������������0000000�0000000�0000000�00000000026�00000000000�010213� x����������������������������������������������������������������������������������������������������ustar�00�������������������������������������������������������������������������������������������������������������������������������������������������������������������������������������������������������������������������������������������������������22 mtime=1711671226.0
����������������������������������������������������������������������������������������������������������������������������������������������������������������������������������������������������������������������������������������������������������������������������������������������������������������������������������������������������������������������������������������������������������������������������������������������������������������������������������������������������������ixbrl-viewer-1.4.22/.github/workflows/python-package.yml��������������������������������������������0000644�0001751�0000177�00000005622�14601403672�022666� 0����������������������������������������������������������������������������������������������������ustar�00runner��������������������������docker�����������������������������������������������������������������������������������������������������������������������������������������������������������������������������������������������������������������name: Build and publish Python package
on:
workflow_call:
inputs:
node_version:
default: '20'
description: 'Node version to use'
required: false
type: string
python_version:
default: '3.12'
description: 'Python version to use'
required: false
type: string
workflow_dispatch:
inputs:
node_version:
default: '20'
description: 'Node version to use'
required: true
type: string
python_version:
default: '3.12'
description: 'Python version to use'
required: true
type: string
permissions: {}
jobs:
build-package:
runs-on: ubuntu-22.04
steps:
- name: Checkout ixbrl-viewer
uses: actions/checkout@v4.1.2
with:
fetch-depth: 0
- name: Install Node.js
uses: actions/setup-node@v4.0.2
with:
cache: 'npm'
check-latest: true
node-version: ${{ inputs.node_version }}
- name: Install npm dependencies
run: npm ci
- name: Build ixbrlviewer.js
run: make prod
- name: Install Python
uses: actions/setup-python@v5.0.0
with:
cache: 'pip'
cache-dependency-path: '**/pyproject.toml'
check-latest: true
python-version: ${{ inputs.python_version }}
- name: Install Python dependencies
run: |
python -m pip install --upgrade pip setuptools wheel
pip install build
- name: Build Python package
run: python -m build
- name: Upload source distribution artifact
uses: actions/upload-artifact@v4.3.1
with:
name: source distribution
if-no-files-found: error
path: dist/*.tar.gz
- name: Upload wheel artifact
uses: actions/upload-artifact@v4.3.1
with:
name: wheel
if-no-files-found: error
path: dist/*.whl
publish-package:
needs: build-package
environment: release
permissions:
contents: write
runs-on: ubuntu-22.04
if: startsWith(github.ref, 'refs/tags')
steps:
- name: Install twine
run: pip install -U twine
- name: Download source distribution artifact
uses: actions/download-artifact@v4.1.4
with:
name: source distribution
- name: Download wheel artifact
uses: actions/download-artifact@v4.1.4
with:
name: wheel
- name: Publish package on release
env:
TWINE_USERNAME: ${{ secrets.TWINE_USERNAME }}
TWINE_PASSWORD: ${{ secrets.TWINE_PASSWORD }}
TWINE_REPOSITORY: ${{ github.repository == 'Arelle/ixbrl-viewer' && 'pypi' || 'testpypi' }}
run: twine upload ./*
- name: Upload release artifacts
uses: softprops/action-gh-release@v2.0.4
with:
fail_on_unmatched_files: true
files: './*'
��������������������������������������������������������������������������������������������������������������././@PaxHeader��������������������������������������������������������������������������������������0000000�0000000�0000000�00000000026�00000000000�010213� x����������������������������������������������������������������������������������������������������ustar�00�������������������������������������������������������������������������������������������������������������������������������������������������������������������������������������������������������������������������������������������������������22 mtime=1711671226.0
����������������������������������������������������������������������������������������������������������������������������������������������������������������������������������������������������������������������������������������������������������������������������������������������������������������������������������������������������������������������������������������������������������������������������������������������������������������������������������������������������������ixbrl-viewer-1.4.22/.github/workflows/python-tests.yml����������������������������������������������0000644�0001751�0000177�00000001701�14601403672�022427� 0����������������������������������������������������������������������������������������������������ustar�00runner��������������������������docker�����������������������������������������������������������������������������������������������������������������������������������������������������������������������������������������������������������������name: Run Python Unit Tests
on:
pull_request:
branches:
- master
workflow_call:
workflow_dispatch:
permissions: {}
jobs:
tests:
strategy:
fail-fast: false
matrix:
os:
- macos-12
- ubuntu-22.04
- windows-2022
python-version:
- '3.8'
- '3.9'
- '3.10'
- '3.11'
- '3.12'
runs-on: ${{ matrix.os }}
steps:
- uses: actions/checkout@v4.1.2
- name: Install Python 3
uses: actions/setup-python@v5.0.0
with:
cache: 'pip'
cache-dependency-path: '**/pyproject.toml'
check-latest: true
python-version: ${{ matrix.python-version }}
- name: Install dependencies
run: |
python -m pip install --upgrade pip setuptools wheel
pip install .[arelle,dev]
pip install tox tox-gh-actions
- name: Test with tox
run: tox
���������������������������������������������������������������././@PaxHeader��������������������������������������������������������������������������������������0000000�0000000�0000000�00000000026�00000000000�010213� x����������������������������������������������������������������������������������������������������ustar�00�������������������������������������������������������������������������������������������������������������������������������������������������������������������������������������������������������������������������������������������������������22 mtime=1711671226.0
����������������������������������������������������������������������������������������������������������������������������������������������������������������������������������������������������������������������������������������������������������������������������������������������������������������������������������������������������������������������������������������������������������������������������������������������������������������������������������������������������������ixbrl-viewer-1.4.22/.github/workflows/release-drafter.yml�������������������������������������������0000644�0001751�0000177�00000000514�14601403672�023014� 0����������������������������������������������������������������������������������������������������ustar�00runner��������������������������docker�����������������������������������������������������������������������������������������������������������������������������������������������������������������������������������������������������������������name: Release Drafter
on:
push:
branches:
- master
permissions: {}
jobs:
update_release_draft:
runs-on: ubuntu-22.04
permissions:
contents: write
pull-requests: read
steps:
- uses: release-drafter/release-drafter@v6.0.0
env:
GITHUB_TOKEN: ${{ secrets.GITHUB_TOKEN }}
������������������������������������������������������������������������������������������������������������������������������������������������������������������������������������././@PaxHeader��������������������������������������������������������������������������������������0000000�0000000�0000000�00000000026�00000000000�010213� x����������������������������������������������������������������������������������������������������ustar�00�������������������������������������������������������������������������������������������������������������������������������������������������������������������������������������������������������������������������������������������������������22 mtime=1711671226.0
����������������������������������������������������������������������������������������������������������������������������������������������������������������������������������������������������������������������������������������������������������������������������������������������������������������������������������������������������������������������������������������������������������������������������������������������������������������������������������������������������������ixbrl-viewer-1.4.22/.github/workflows/release.yml���������������������������������������������������0000644�0001751�0000177�00000000755�14601403672�021376� 0����������������������������������������������������������������������������������������������������ustar�00runner��������������������������docker�����������������������������������������������������������������������������������������������������������������������������������������������������������������������������������������������������������������name: Release
on:
release:
types: [released]
permissions: {}
jobs:
node-tests:
uses: ./.github/workflows/node-tests.yml
npm-package:
permissions:
contents: write
needs: node-tests
uses: ./.github/workflows/npm-package.yml
secrets: inherit
python-tests:
uses: ./.github/workflows/python-tests.yml
python-package:
permissions:
contents: write
needs: python-tests
uses: ./.github/workflows/python-package.yml
secrets: inherit
�������������������././@PaxHeader��������������������������������������������������������������������������������������0000000�0000000�0000000�00000000026�00000000000�010213� x����������������������������������������������������������������������������������������������������ustar�00�������������������������������������������������������������������������������������������������������������������������������������������������������������������������������������������������������������������������������������������������������22 mtime=1711671226.0
����������������������������������������������������������������������������������������������������������������������������������������������������������������������������������������������������������������������������������������������������������������������������������������������������������������������������������������������������������������������������������������������������������������������������������������������������������������������������������������������������������ixbrl-viewer-1.4.22/.gitignore����������������������������������������������������������������������0000644�0001751�0000177�00000000407�14601403672�015620� 0����������������������������������������������������������������������������������������������������ustar�00runner��������������������������docker�����������������������������������������������������������������������������������������������������������������������������������������������������������������������������������������������������������������.idea
.mypy_cache
.pytest_cache
.tox
.vscode
build
node_modules/
dist/
__pycache__
/tests/puppeteer/artifacts/
iXBRLViewerPlugin/viewer/src/fonts/
iXBRLViewerPlugin/viewer/src/less/generated/
iXBRLViewerPlugin/_version.py
/ixbrl-viewer*.tgz
ixbrl_viewer.egg-info
���������������������������������������������������������������������������������������������������������������������������������������������������������������������������������������������������������������������������������������������������������././@PaxHeader��������������������������������������������������������������������������������������0000000�0000000�0000000�00000000026�00000000000�010213� x����������������������������������������������������������������������������������������������������ustar�00�������������������������������������������������������������������������������������������������������������������������������������������������������������������������������������������������������������������������������������������������������22 mtime=1711671226.0
����������������������������������������������������������������������������������������������������������������������������������������������������������������������������������������������������������������������������������������������������������������������������������������������������������������������������������������������������������������������������������������������������������������������������������������������������������������������������������������������������������ixbrl-viewer-1.4.22/ARCHITECTURE.md�����������������������������������������������������������������0000644�0001751�0000177�00000006776�14601403672�016053� 0����������������������������������������������������������������������������������������������������ustar�00runner��������������������������docker�����������������������������������������������������������������������������������������������������������������������������������������������������������������������������������������������������������������# Inline XBRL Viewer architecture
This document provides developer documentation for various aspects of the
Inline XBRL Viewer.
## JSON data
The viewer relies on a block of JSON data that is embedded within the primary
XHTML file of the viewer. This avoids having to do full XBRL processing within
the viewer, and avoids the need to access the report's taxonomy from the
viewer.
The format of the JSON data is described below. Newer viewers are expected to
work correctly with data generated by an older plugin version within the same
major version, degrading new features gracefully if required.
```
{
"features": [],
"prefixes": {},
"roles": {},
"languages": {},
"sourceReports": [
{
"docSetFiles": [],
"targetReports": [
{
"localDocs": {},
"roleDefs": {},
"concepts": {},
"facts": {},
"rels": {},
}
]
}
],
"validation": [],
"filingDocuments": "foo.zip"
}
```
A viewer can contain one or more "source reports", each producing one or more
target report.
A source report is an Inline XBRL Document Set, comprising one or more Inline
XBRL Documents. A target report is the XBRL data obtained from extracting a
given target document from the source report.
Target documents are not yet supported, so at present, there will always be one
target report per source report.
### prefixes
`prefixes` is a map of namespace prefixes to namespace URIs. It is shared by
all Target Reports.
### languages
```
"languages": {
"en-us": "English (US)",
"en": "English",
"fr": "French",
},
```
A map of language codes to language labels. There should be an entry here for
every language code used by a label in a report.
### sourceReports
`sourceReports` is an array of objects of report data. Prior to multi-document
support, this property was not present, and the `docSetFiles` property, and the
properties of the objects within `targetReports` appeared at the top-level.
There is an object in this array for each separate Inline XBRL Document Set in
the viewer.
### docSetFiles
`docSetFiles` is a list of files in the document set. It is used to load other
documents in the document set into iframes in tabs in the viewer.
`docSetFiles` is a list of relative URLs.
### targetReports
An array of objects, one for each target document obtained from the enclosing
source report.
### localDocs
```
{
"filename.xsd": ["schema"],
"inline.xhtml": ["inline"],
}
```
`localDocs` is the set of XBRL files local to the filing (i.e. the Inline XBRL
files, and any extension taxonomies).
The property is used to populate a summary of the files in the filing in the
document summary panel.
## IDs and Viewer Unique IDs
The viewer requires all iXBRL facts to have `id` attributes. The Python plugin
will add `id` attributes to facts if not present. IDs are required to be unique
within an Inline XBRL Document Set, but in order to avoid collisions between IDs
in different Inline XBRL Document Sets when multiple source reports are
present, the JavaScript viewer internally uses "viewer unique IDs", which are
the `id` attribute values prefixed by the source report index (e.g `0-f1` is
`f1` in the first report). The original `id` attributes are only used to
resolve footnotes and continuation chains during the pre-process phase. Facts
are selected via the `ivids` data attribute on wrapper nodes, which uses viewer
unique IDs.
��././@PaxHeader��������������������������������������������������������������������������������������0000000�0000000�0000000�00000000026�00000000000�010213� x����������������������������������������������������������������������������������������������������ustar�00�������������������������������������������������������������������������������������������������������������������������������������������������������������������������������������������������������������������������������������������������������22 mtime=1711671226.0
����������������������������������������������������������������������������������������������������������������������������������������������������������������������������������������������������������������������������������������������������������������������������������������������������������������������������������������������������������������������������������������������������������������������������������������������������������������������������������������������������������ixbrl-viewer-1.4.22/CODEOWNERS����������������������������������������������������������������������0000644�0001751�0000177�00000000021�14601403672�015213� 0����������������������������������������������������������������������������������������������������ustar�00runner��������������������������docker�����������������������������������������������������������������������������������������������������������������������������������������������������������������������������������������������������������������* @Arelle/arelle
���������������������������������������������������������������������������������������������������������������������������������������������������������������������������������������������������������������������������������������������������������������������������������������������������������������������������������������������������������������������������������������������������������������������������������������������������������������������������������������������������������������././@PaxHeader��������������������������������������������������������������������������������������0000000�0000000�0000000�00000000026�00000000000�010213� x����������������������������������������������������������������������������������������������������ustar�00�������������������������������������������������������������������������������������������������������������������������������������������������������������������������������������������������������������������������������������������������������22 mtime=1711671226.0
����������������������������������������������������������������������������������������������������������������������������������������������������������������������������������������������������������������������������������������������������������������������������������������������������������������������������������������������������������������������������������������������������������������������������������������������������������������������������������������������������������ixbrl-viewer-1.4.22/COPYRIGHT.md��������������������������������������������������������������������0000644�0001751�0000177�00000000051�14601403672�015515� 0����������������������������������������������������������������������������������������������������ustar�00runner��������������������������docker�����������������������������������������������������������������������������������������������������������������������������������������������������������������������������������������������������������������(c) Copyright 2018-present Workiva, Inc.
���������������������������������������������������������������������������������������������������������������������������������������������������������������������������������������������������������������������������������������������������������������������������������������������������������������������������������������������������������������������������������������������������������������������������������������������������������������������������������������././@PaxHeader��������������������������������������������������������������������������������������0000000�0000000�0000000�00000000026�00000000000�010213� x����������������������������������������������������������������������������������������������������ustar�00�������������������������������������������������������������������������������������������������������������������������������������������������������������������������������������������������������������������������������������������������������22 mtime=1711671226.0
����������������������������������������������������������������������������������������������������������������������������������������������������������������������������������������������������������������������������������������������������������������������������������������������������������������������������������������������������������������������������������������������������������������������������������������������������������������������������������������������������������ixbrl-viewer-1.4.22/LICENSE�������������������������������������������������������������������������0000644�0001751�0000177�00000040405�14601403672�014637� 0����������������������������������������������������������������������������������������������������ustar�00runner��������������������������docker�����������������������������������������������������������������������������������������������������������������������������������������������������������������������������������������������������������������
ixbrl-viewer
Copyright 2019 Workiva Inc.
Licensed under the Apache License, Version 2.0 (the "License");
you may not use this file except in compliance with the License.
You may obtain a copy of the License at
http://www.apache.org/licenses/LICENSE-2.0
Unless required by applicable law or agreed to in writing, software
distributed under the License is distributed on an "AS IS" BASIS,
WITHOUT WARRANTIES OR CONDITIONS OF ANY KIND, either express or implied.
See the License for the specific language governing permissions and
limitations under the License.
---
This ixbrl-viewer software includes a number of subcomponents with separate copyright notices and/or license
terms. Your use of the source code for these subcomponents is subject to the terms and conditions of the
following licenses:
chart.js
Copyright (c) 2018 Chart.js Contributors
Permission is hereby granted, free of charge, to any person obtaining a copy of this software and associated
documentation files (the "Software"), to deal in the Software without restriction, including without limitation
the rights to use, copy, modify, merge, publish, distribute, sublicense, and/or sell copies of the Software,
and to permit persons to whom the Software is furnished to do so, subject to the following conditions:
The above copyright notice and this permission notice shall be included in all copies or substantial portions of the Software.
THE SOFTWARE IS PROVIDED "AS IS", WITHOUT WARRANTY OF ANY KIND, EXPRESS OR IMPLIED, INCLUDING BUT NOT LIMITED
TO THE WARRANTIES OF MERCHANTABILITY, FITNESS FOR A PARTICULAR PURPOSE AND NONINFRINGEMENT. IN NO EVENT SHALL
THE AUTHORS OR COPYRIGHT HOLDERS BE LIABLE FOR ANY CLAIM, DAMAGES OR OTHER LIABILITY, WHETHER IN AN ACTION OF
CONTRACT, TORT OR OTHERWISE, ARISING FROM, OUT OF OR IN CONNECTION WITH THE SOFTWARE OR THE USE OR OTHER
DEALINGS IN THE SOFTWARE.
chartjs-color
Copyright (c) 2012 Heather Arthur
Permission is hereby granted, free of charge, to any person obtaining
a copy of this software and associated documentation files (the
"Software"), to deal in the Software without restriction, including
without limitation the rights to use, copy, modify, merge, publish,
distribute, sublicense, and/or sell copies of the Software, and to
permit persons to whom the Software is furnished to do so, subject to
the following conditions:
The above copyright notice and this permission notice shall be
included in all copies or substantial portions of the Software.
THE SOFTWARE IS PROVIDED "AS IS", WITHOUT WARRANTY OF ANY KIND,
EXPRESS OR IMPLIED, INCLUDING BUT NOT LIMITED TO THE WARRANTIES OF
MERCHANTABILITY, FITNESS FOR A PARTICULAR PURPOSE AND
NONINFRINGEMENT. IN NO EVENT SHALL THE AUTHORS OR COPYRIGHT HOLDERS BE
LIABLE FOR ANY CLAIM, DAMAGES OR OTHER LIABILITY, WHETHER IN AN ACTION
OF CONTRACT, TORT OR OTHERWISE, ARISING FROM, OUT OF OR IN CONNECTION
WITH THE SOFTWARE OR THE USE OR OTHER DEALINGS IN THE SOFTWARE.
chartjs-color-string
Copyright (c) 2011 Heather Arthur
Permission is hereby granted, free of charge, to any person obtaining
a copy of this software and associated documentation files (the
"Software"), to deal in the Software without restriction, including
without limitation the rights to use, copy, modify, merge, publish,
distribute, sublicense, and/or sell copies of the Software, and to
permit persons to whom the Software is furnished to do so, subject to
the following conditions:
The above copyright notice and this permission notice shall be
included in all copies or substantial portions of the Software.
THE SOFTWARE IS PROVIDED "AS IS", WITHOUT WARRANTY OF ANY KIND,
EXPRESS OR IMPLIED, INCLUDING BUT NOT LIMITED TO THE WARRANTIES OF
MERCHANTABILITY, FITNESS FOR A PARTICULAR PURPOSE AND
NONINFRINGEMENT. IN NO EVENT SHALL THE AUTHORS OR COPYRIGHT HOLDERS BE
LIABLE FOR ANY CLAIM, DAMAGES OR OTHER LIABILITY, WHETHER IN AN ACTION
OF CONTRACT, TORT OR OTHERWISE, ARISING FROM, OUT OF OR IN CONNECTION
WITH THE SOFTWARE OR THE USE OR OTHER DEALINGS IN THE SOFTWARE.
color-convert
Copyright (c) 2011 Heather Arthur
Permission is hereby granted, free of charge, to any person obtaining
a copy of this software and associated documentation files (the
"Software"), to deal in the Software without restriction, including
without limitation the rights to use, copy, modify, merge, publish,
distribute, sublicense, and/or sell copies of the Software, and to
permit persons to whom the Software is furnished to do so, subject to
the following conditions:
The above copyright notice and this permission notice shall be
included in all copies or substantial portions of the Software.
THE SOFTWARE IS PROVIDED "AS IS", WITHOUT WARRANTY OF ANY KIND,
EXPRESS OR IMPLIED, INCLUDING BUT NOT LIMITED TO THE WARRANTIES OF
MERCHANTABILITY, FITNESS FOR A PARTICULAR PURPOSE AND
NONINFRINGEMENT. IN NO EVENT SHALL THE AUTHORS OR COPYRIGHT HOLDERS BE
LIABLE FOR ANY CLAIM, DAMAGES OR OTHER LIABILITY, WHETHER IN AN ACTION
OF CONTRACT, TORT OR OTHERWISE, ARISING FROM, OUT OF OR IN CONNECTION
WITH THE SOFTWARE OR THE USE OR OTHER DEALINGS IN THE SOFTWARE.
color-name
Copyright (c) 2015 Dmitry Ivanov
Permission is hereby granted, free of charge, to any person obtaining a copy of this software and associated
documentation files (the "Software"), to deal in the Software without restriction, including without limitation
the rights to use, copy, modify, merge, publish, distribute, sublicense, and/or sell copies of the Software,
and to permit persons to whom the Software is furnished to do so, subject to the following conditions:
The above copyright notice and this permission notice shall be included in all copies or substantial portions of the Software.
THE SOFTWARE IS PROVIDED "AS IS", WITHOUT WARRANTY OF ANY KIND, EXPRESS OR IMPLIED, INCLUDING BUT NOT LIMITED
TO THE WARRANTIES OF MERCHANTABILITY, FITNESS FOR A PARTICULAR PURPOSE AND NONINFRINGEMENT. IN NO EVENT SHALL
THE AUTHORS OR COPYRIGHT HOLDERS BE LIABLE FOR ANY CLAIM, DAMAGES OR OTHER LIABILITY, WHETHER IN AN ACTION OF
CONTRACT, TORT OR OTHERWISE, ARISING FROM, OUT OF OR IN CONNECTION WITH THE SOFTWARE OR THE USE OR OTHER
DEALINGS IN THE SOFTWARE.
css-loader
Copyright JS Foundation and other contributors
Permission is hereby granted, free of charge, to any person obtaining
a copy of this software and associated documentation files (the
'Software'), to deal in the Software without restriction, including
without limitation the rights to use, copy, modify, merge, publish,
distribute, sublicense, and/or sell copies of the Software, and to
permit persons to whom the Software is furnished to do so, subject to
the following conditions:
The above copyright notice and this permission notice shall be
included in all copies or substantial portions of the Software.
THE SOFTWARE IS PROVIDED 'AS IS', WITHOUT WARRANTY OF ANY KIND,
EXPRESS OR IMPLIED, INCLUDING BUT NOT LIMITED TO THE WARRANTIES OF
MERCHANTABILITY, FITNESS FOR A PARTICULAR PURPOSE AND NONINFRINGEMENT.
IN NO EVENT SHALL THE AUTHORS OR COPYRIGHT HOLDERS BE LIABLE FOR ANY
CLAIM, DAMAGES OR OTHER LIABILITY, WHETHER IN AN ACTION OF CONTRACT,
TORT OR OTHERWISE, ARISING FROM, OUT OF OR IN CONNECTION WITH THE
SOFTWARE OR THE USE OR OTHER DEALINGS IN THE SOFTWARE.
dateformat
(c) 2007-2009 Steven Levithan
Permission is hereby granted, free of charge, to any person obtaining
a copy of this software and associated documentation files (the
"Software"), to deal in the Software without restriction, including
without limitation the rights to use, copy, modify, merge, publish,
distribute, sublicense, and/or sell copies of the Software, and to
permit persons to whom the Software is furnished to do so, subject to
the following conditions:
The above copyright notice and this permission notice shall be
included in all copies or substantial portions of the Software.
THE SOFTWARE IS PROVIDED "AS IS", WITHOUT WARRANTY OF ANY KIND,
EXPRESS OR IMPLIED, INCLUDING BUT NOT LIMITED TO THE WARRANTIES OF
MERCHANTABILITY, FITNESS FOR A PARTICULAR PURPOSE AND
NONINFRINGEMENT. IN NO EVENT SHALL THE AUTHORS OR COPYRIGHT HOLDERS BE
LIABLE FOR ANY CLAIM, DAMAGES OR OTHER LIABILITY, WHETHER IN AN ACTION
OF CONTRACT, TORT OR OTHERWISE, ARISING FROM, OUT OF OR IN CONNECTION
WITH THE SOFTWARE OR THE USE OR OTHER DEALINGS IN THE SOFTWARE.
interactjs
Copyright (c) 2012-2017 Taye Adeyemi
Permission is hereby granted, free of charge, to any person
obtaining a copy of this software and associated
documentation files (the "Software"), to deal in the Software
without restriction, including without limitation the rights
to use, copy, modify, merge, publish, distribute, sublicense,
and/or sell copies of the Software, and to permit persons to
whom the Software is furnished to do so, subject to the
following conditions:
The above copyright notice and this permission notice shall
be included in all copies or substantial portions of the
Software.
THE SOFTWARE IS PROVIDED "AS IS", WITHOUT WARRANTY OF ANY
KIND, EXPRESS OR IMPLIED, INCLUDING BUT NOT LIMITED TO THE
WARRANTIES OF MERCHANTABILITY, FITNESS FOR A PARTICULAR
PURPOSE AND NONINFRINGEMENT. IN NO EVENT SHALL THE AUTHORS OR
COPYRIGHT HOLDERS BE LIABLE FOR ANY CLAIM, DAMAGES OR OTHER
LIABILITY, WHETHER IN AN ACTION OF CONTRACT, TORT OR
OTHERWISE, ARISING FROM, OUT OF OR IN CONNECTION WITH THE
SOFTWARE OR THE USE OR OTHER DEALINGS IN THE SOFTWARE.
jquery
Copyright JS Foundation and other contributors, https://js.foundation/
This software consists of voluntary contributions made by many
individuals. For exact contribution history, see the revision history
available at https://github.com/jquery/jquery
The following license applies to all parts of this software except as
documented below:
====
Permission is hereby granted, free of charge, to any person obtaining
a copy of this software and associated documentation files (the
"Software"), to deal in the Software without restriction, including
without limitation the rights to use, copy, modify, merge, publish,
distribute, sublicense, and/or sell copies of the Software, and to
permit persons to whom the Software is furnished to do so, subject to
the following conditions:
The above copyright notice and this permission notice shall be
included in all copies or substantial portions of the Software.
THE SOFTWARE IS PROVIDED "AS IS", WITHOUT WARRANTY OF ANY KIND,
EXPRESS OR IMPLIED, INCLUDING BUT NOT LIMITED TO THE WARRANTIES OF
MERCHANTABILITY, FITNESS FOR A PARTICULAR PURPOSE AND
NONINFRINGEMENT. IN NO EVENT SHALL THE AUTHORS OR COPYRIGHT HOLDERS BE
LIABLE FOR ANY CLAIM, DAMAGES OR OTHER LIABILITY, WHETHER IN AN ACTION
OF CONTRACT, TORT OR OTHERWISE, ARISING FROM, OUT OF OR IN CONNECTION
WITH THE SOFTWARE OR THE USE OR OTHER DEALINGS IN THE SOFTWARE.
====
All files located in the node_modules and external directories are
externally maintained libraries used by this software which have their
own licenses; we recommend you read them, as their terms may differ from
the terms above.
lunr
Copyright (C) 2013 by Oliver Nightingale
Permission is hereby granted, free of charge, to any person obtaining a copy
of this software and associated documentation files (the "Software"), to deal
in the Software without restriction, including without limitation the rights
to use, copy, modify, merge, publish, distribute, sublicense, and/or sell
copies of the Software, and to permit persons to whom the Software is
furnished to do so, subject to the following conditions:
The above copyright notice and this permission notice shall be included in
all copies or substantial portions of the Software.
THE SOFTWARE IS PROVIDED "AS IS", WITHOUT WARRANTY OF ANY KIND, EXPRESS OR
IMPLIED, INCLUDING BUT NOT LIMITED TO THE WARRANTIES OF MERCHANTABILITY,
FITNESS FOR A PARTICULAR PURPOSE AND NONINFRINGEMENT. IN NO EVENT SHALL THE
AUTHORS OR COPYRIGHT HOLDERS BE LIABLE FOR ANY CLAIM, DAMAGES OR OTHER
LIABILITY, WHETHER IN AN ACTION OF CONTRACT, TORT OR OTHERWISE, ARISING FROM,
OUT OF OR IN CONNECTION WITH THE SOFTWARE OR THE USE OR OTHER DEALINGS IN
THE SOFTWARE.
moment
Copyright (c) JS Foundation and other contributors
Permission is hereby granted, free of charge, to any person
obtaining a copy of this software and associated documentation
files (the "Software"), to deal in the Software without
restriction, including without limitation the rights to use,
copy, modify, merge, publish, distribute, sublicense, and/or sell
copies of the Software, and to permit persons to whom the
Software is furnished to do so, subject to the following
conditions:
The above copyright notice and this permission notice shall be
included in all copies or substantial portions of the Software.
THE SOFTWARE IS PROVIDED "AS IS", WITHOUT WARRANTY OF ANY KIND,
EXPRESS OR IMPLIED, INCLUDING BUT NOT LIMITED TO THE WARRANTIES
OF MERCHANTABILITY, FITNESS FOR A PARTICULAR PURPOSE AND
NONINFRINGEMENT. IN NO EVENT SHALL THE AUTHORS OR COPYRIGHT
HOLDERS BE LIABLE FOR ANY CLAIM, DAMAGES OR OTHER LIABILITY,
WHETHER IN AN ACTION OF CONTRACT, TORT OR OTHERWISE, ARISING
FROM, OUT OF OR IN CONNECTION WITH THE SOFTWARE OR THE USE OR
OTHER DEALINGS IN THE SOFTWARE.
webfont
Copyright (c) 2016-present itgalaxy inc.
Permission is hereby granted, free of charge, to any person obtaining a copy of this software and associated
documentation files (the "Software"), to deal in the Software without restriction, including without limitation
the rights to use, copy, modify, merge, publish, distribute, sublicense, and/or sell copies of the Software,
and to permit persons to whom the Software is furnished to do so, subject to the following conditions:
The above copyright notice and this permission notice shall be included in all copies or substantial portions
of the Software.
THE SOFTWARE IS PROVIDED "AS IS", WITHOUT WARRANTY OF ANY KIND, EXPRESS OR IMPLIED, INCLUDING BUT NOT LIMITED
TO THE WARRANTIES OF MERCHANTABILITY, FITNESS FOR A PARTICULAR PURPOSE AND NONINFRINGEMENT. IN NO EVENT SHALL THE
AUTHORS OR COPYRIGHT HOLDERS BE LIABLE FOR ANY CLAIM, DAMAGES OR OTHER LIABILITY, WHETHER IN AN ACTION OF CONTRACT,
TORT OR OTHERWISE, ARISING FROM, OUT OF OR IN CONNECTION WITH THE SOFTWARE OR THE USE OR OTHER DEALINGS
IN THE SOFTWARE.
webpack
Copyright JS Foundation and other contributors
Permission is hereby granted, free of charge, to any person obtaining
a copy of this software and associated documentation files (the
'Software'), to deal in the Software without restriction, including
without limitation the rights to use, copy, modify, merge, publish,
distribute, sublicense, and/or sell copies of the Software, and to
permit persons to whom the Software is furnished to do so, subject to
the following conditions:
The above copyright notice and this permission notice shall be
included in all copies or substantial portions of the Software.
THE SOFTWARE IS PROVIDED 'AS IS', WITHOUT WARRANTY OF ANY KIND,
EXPRESS OR IMPLIED, INCLUDING BUT NOT LIMITED TO THE WARRANTIES OF
MERCHANTABILITY, FITNESS FOR A PARTICULAR PURPOSE AND NONINFRINGEMENT.
IN NO EVENT SHALL THE AUTHORS OR COPYRIGHT HOLDERS BE LIABLE FOR ANY
CLAIM, DAMAGES OR OTHER LIABILITY, WHETHER IN AN ACTION OF CONTRACT,
TORT OR OTHERWISE, ARISING FROM, OUT OF OR IN CONNECTION WITH THE
SOFTWARE OR THE USE OR OTHER DEALINGS IN THE SOFTWARE.
write-excel-file
Copyright (c) 2018 gitlab.com/catamphetamine
Permission is hereby granted, free of charge, to any person obtaining a copy
of this software and associated documentation files (the "Software"), to deal
in the Software without restriction, including without limitation the rights
to use, copy, modify, merge, publish, distribute, sublicense, and/or sell
copies of the Software, and to permit persons to whom the Software is
furnished to do so, subject to the following conditions:
The above copyright notice and this permission notice shall be included in all
copies or substantial portions of the Software.
THE SOFTWARE IS PROVIDED "AS IS", WITHOUT WARRANTY OF ANY KIND, EXPRESS OR
IMPLIED, INCLUDING BUT NOT LIMITED TO THE WARRANTIES OF MERCHANTABILITY,
FITNESS FOR A PARTICULAR PURPOSE AND NONINFRINGEMENT. IN NO EVENT SHALL THE
AUTHORS OR COPYRIGHT HOLDERS BE LIABLE FOR ANY CLAIM, DAMAGES OR OTHER
LIABILITY, WHETHER IN AN ACTION OF CONTRACT, TORT OR OTHERWISE, ARISING FROM,
OUT OF OR IN CONNECTION WITH THE SOFTWARE OR THE USE OR OTHER DEALINGS IN THE
SOFTWARE.
---
�����������������������������������������������������������������������������������������������������������������������������������������������������������������������������������������������������������������������������������������������������������././@PaxHeader��������������������������������������������������������������������������������������0000000�0000000�0000000�00000000026�00000000000�010213� x����������������������������������������������������������������������������������������������������ustar�00�������������������������������������������������������������������������������������������������������������������������������������������������������������������������������������������������������������������������������������������������������22 mtime=1711671226.0
����������������������������������������������������������������������������������������������������������������������������������������������������������������������������������������������������������������������������������������������������������������������������������������������������������������������������������������������������������������������������������������������������������������������������������������������������������������������������������������������������������ixbrl-viewer-1.4.22/MANIFEST.in���������������������������������������������������������������������0000644�0001751�0000177�00000000044�14601403672�015363� 0����������������������������������������������������������������������������������������������������ustar�00runner��������������������������docker�����������������������������������������������������������������������������������������������������������������������������������������������������������������������������������������������������������������graft iXBRLViewerPlugin/viewer/dist
��������������������������������������������������������������������������������������������������������������������������������������������������������������������������������������������������������������������������������������������������������������������������������������������������������������������������������������������������������������������������������������������������������������������������������������������������������������������������������������������././@PaxHeader��������������������������������������������������������������������������������������0000000�0000000�0000000�00000000026�00000000000�010213� x����������������������������������������������������������������������������������������������������ustar�00�������������������������������������������������������������������������������������������������������������������������������������������������������������������������������������������������������������������������������������������������������22 mtime=1711671226.0
����������������������������������������������������������������������������������������������������������������������������������������������������������������������������������������������������������������������������������������������������������������������������������������������������������������������������������������������������������������������������������������������������������������������������������������������������������������������������������������������������������ixbrl-viewer-1.4.22/Makefile������������������������������������������������������������������������0000644�0001751�0000177�00000003252�14601403672�015271� 0����������������������������������������������������������������������������������������������������ustar�00runner��������������������������docker�����������������������������������������������������������������������������������������������������������������������������������������������������������������������������������������������������������������# Copyright 2019 Workiva Inc.
#
# Licensed under the Apache License, Version 2.0 (the "License");
# you may not use this file except in compliance with the License.
# You may obtain a copy of the License at
#
# http://www.apache.org/licenses/LICENSE-2.0
#
# Unless required by applicable law or agreed to in writing, software
# distributed under the License is distributed on an "AS IS" BASIS,
# WITHOUT WARRANTIES OR CONDITIONS OF ANY KIND, either express or implied.
# See the License for the specific language governing permissions and
# limitations under the License.
all: dev
samples: Arelle
$(MAKE) -C $@
dev: iXBRLViewerPlugin/viewer/dist/ixbrl_viewer.dev.js
prod: iXBRLViewerPlugin/viewer/dist/ixbrl_viewer.js
font: iXBRLViewerPlugin/viewer/src/less/generated/icons.less
FONT_FILES := iXBRLViewerPlugin/viewer/src/icons/*.svg iXBRLViewerPlugin/viewer/src/less/icons.less.njk iXBRLViewerPlugin/viewer/tools/build-font.js
iXBRLViewerPlugin/viewer/src/less/generated/icons.less: $(FONT_FILES)
npm run font
iXBRLViewerPlugin/viewer/dist/ixbrl_viewer.dev.js: iXBRLViewerPlugin/viewer/src/*/* iXBRLViewerPlugin/viewer/src/less/generated/icons.less
npm run dev
iXBRLViewerPlugin/viewer/dist/ixbrl_viewer.js: iXBRLViewerPlugin/viewer/src/*/* iXBRLViewerPlugin/viewer/src/less/generated/icons.less
npm run prod
test: testplugin testviewer
testplugin:
pytest tests/unit_tests
Arelle:
git clone https://github.com/Arelle/Arelle.git Arelle
testviewer:
npm run test
DATE ::= $(shell date "+%Y%m%d")
DIST ::= ixbrl_viewer-$(DATE)
dist: prod
mkdir -p $(DIST)
cp -r iXBRLViewerPlugin js/dist/ixbrlviewer.js $(DIST)
zip -r $(DIST).zip $(DIST) -x \*/__pycache__/\* \*/.\*
.PHONY: samples
������������������������������������������������������������������������������������������������������������������������������������������������������������������������������������������������������������������������������������������������������������������������������������������������������������������������������������������������������././@PaxHeader��������������������������������������������������������������������������������������0000000�0000000�0000000�00000000026�00000000000�010213� x����������������������������������������������������������������������������������������������������ustar�00�������������������������������������������������������������������������������������������������������������������������������������������������������������������������������������������������������������������������������������������������������22 mtime=1711671226.0
����������������������������������������������������������������������������������������������������������������������������������������������������������������������������������������������������������������������������������������������������������������������������������������������������������������������������������������������������������������������������������������������������������������������������������������������������������������������������������������������������������ixbrl-viewer-1.4.22/NOTICE��������������������������������������������������������������������������0000644�0001751�0000177�00000001066�14601403672�014536� 0����������������������������������������������������������������������������������������������������ustar�00runner��������������������������docker�����������������������������������������������������������������������������������������������������������������������������������������������������������������������������������������������������������������ixbrl-viewer
Copyright 2019 Workiva Inc.
Licensed under the Apache License, Version 2.0 (the "License");
you may not use this file except in compliance with the License.
You may obtain a copy of the License at
http://www.apache.org/licenses/LICENSE-2.0
Unless required by applicable law or agreed to in writing, software
distributed under the License is distributed on an "AS IS" BASIS,
WITHOUT WARRANTIES OR CONDITIONS OF ANY KIND, either express or implied.
See the License for the specific language governing permissions and
limitations under the License.
��������������������������������������������������������������������������������������������������������������������������������������������������������������������������������������������������������������������������������������������������������������������������������������������������������������������������������������������������������������������������������������������������������������������������������������������������������������������������././@PaxHeader��������������������������������������������������������������������������������������0000000�0000000�0000000�00000000034�00000000000�010212� x����������������������������������������������������������������������������������������������������ustar�00�������������������������������������������������������������������������������������������������������������������������������������������������������������������������������������������������������������������������������������������������������28 mtime=1711671273.6600225
����������������������������������������������������������������������������������������������������������������������������������������������������������������������������������������������������������������������������������������������������������������������������������������������������������������������������������������������������������������������������������������������������������������������������������������������������������������������������������������������������ixbrl-viewer-1.4.22/PKG-INFO������������������������������������������������������������������������0000644�0001751�0000177�00000034556�14601403752�014740� 0����������������������������������������������������������������������������������������������������ustar�00runner��������������������������docker�����������������������������������������������������������������������������������������������������������������������������������������������������������������������������������������������������������������Metadata-Version: 2.1
Name: ixbrl-viewer
Version: 1.4.22
Summary: The Arelle iXBRL Viewer allows iXBRL reports to be viewed interactively in a web browser.
Author-email: "arelle.org"
License: Apache-2.0
Project-URL: Homepage, https://arelle.org/
Project-URL: Downloads, https://arelle.org/arelle/pub/
Project-URL: Documentation, https://arelle.org/arelle/documentation/
Project-URL: Blog, https://arelle.org/arelle/blog/
Project-URL: Source Code, https://github.com/Arelle/ixbrl-viewer
Project-URL: Bug Reports, https://github.com/Arelle/ixbrl-viewer/issues/
Project-URL: Support, https://groups.google.com/g/arelle-users/
Keywords: arelle,plugin,xbrl
Platform: any
Classifier: Development Status :: 5 - Production/Stable
Classifier: Intended Audience :: End Users/Desktop
Classifier: Intended Audience :: Developers
Classifier: License :: OSI Approved :: Apache Software License
Classifier: Natural Language :: English
Classifier: Programming Language :: Python :: 3
Classifier: Programming Language :: Python :: 3.8
Classifier: Programming Language :: Python :: 3.9
Classifier: Programming Language :: Python :: 3.10
Classifier: Programming Language :: Python :: 3.11
Classifier: Programming Language :: Python :: 3.12
Classifier: Operating System :: OS Independent
Classifier: Topic :: Text Processing :: Markup :: XML
Requires-Python: >=3.8
Description-Content-Type: text/markdown
License-File: LICENSE
License-File: NOTICE
Requires-Dist: lxml<6,>=4
Provides-Extra: arelle
Requires-Dist: arelle_release==2.*; extra == "arelle"
Provides-Extra: dev
Requires-Dist: flake8==7.0.0; extra == "dev"
Requires-Dist: lxml-stubs==0.5.1; extra == "dev"
Requires-Dist: mypy==1.9.0; extra == "dev"
Requires-Dist: pytest==8.1.1; extra == "dev"
Requires-Dist: typing-extensions==4.10.0; extra == "dev"
# Arelle iXBRL Viewer
The [Arelle](https://arelle.org/) iXBRL Viewer allows [Inline XBRL](https://www.xbrl.org/ixbrl) (or iXBRL) reports to be
viewed interactively in a web browser. The viewer allows users to access the tagged XBRL data embedded in an iXBRL
report. Key features include:
* Full text search on taxonomy labels and references
* View full details of tagged facts
* Export tables to Excel
* Visualize and navigate calculation relationships
* Produce on-the-fly graphs using XBRL data
A sample viewer is provided in the [examples](https://github.com/Arelle/ixbrl-viewer/blob/master/examples/README.md) for those interested.
The viewer project consists of two components:
* A plugin for the [Arelle](https://www.arelle.org) XBRL tool
* The Javascript viewer application
In order to view an iXBRL report in the viewer, it must first be prepared using
the Arelle plugin. The preparation process updates the iXBRL file to include:
1. A link to the JavaScript viewer
2. A block of JSON data that contains the results of processing the XBRL data and associated taxonomy
Once prepared, the resulting file provides an entirely standalone viewer, and
does not require access to the taxonomy, or to any online services. The only
dependency is on the JavaScript viewer application, which is a single file
which can be accessed directly online, downloaded or built locally.
It is also possible to place the link to the viewer, and the block of JSON data
in a separate file. See Stub Viewer Mode below.
The JavaScript viewer application is a single JavaScript file called ixbrlviewer.js. It
contains all of the JavaScript that runs the viewer functionality.
## Installation
The Python portion of this repo is developed using Python 3.12.
1. Clone the [iXBRL Viewer git repository][ixbrlviewer-github].
2. Download and install [Arelle][arelle-download]
## Accessing the JavaScript viewer application
### Accessing via the CDN
The JavaScript file is available via a CDN. It can be accessed via the following url:
```text
https://cdn.jsdelivr.net/npm/ixbrl-viewer@/iXBRLViewerPlugin/viewer/dist/ixbrlviewer.js
```
Where `` is the current version of ixbrl-viewer you are using. For instance [1.2.0][CDN].
### Accessing via Github
When a new version of ixbrl-viewer is released, the javascript is included as a
release asset. The asset can be found on the releases [page][ixbrlviewer-github-releases] for each version of
the ixbrl-viewer.
### Building the JavaScript locally
1. Install npm. Instructions can be found here:
2. Install the dependencies for javascript by running: `npm install`. This
command must be run from within the `ixbrl-viewer directory` (i.e. the root
of your checkout of the repository).
3. Run `npm run font`. This will build the icon files.
4. Run `npm run prod`. This will create the ixbrlviewer.js in the
iXBRLViewerPlugin/viewer/dist directory.
[ixbrlviewer-github]: https://github.com/Arelle/ixbrl-viewer
[CDN]: https://cdn.jsdelivr.net/npm/ixbrl-viewer@1.2.0/iXBRLViewerPlugin/viewer/dist/ixbrlviewer.js
[ixbrlviewer-github-releases]: https://github.com/Arelle/ixbrl-viewer/releases/tag/0.1.58
[arelle-download]: http://arelle.org/pub
## JavaScript Versioning
The ixbrl-viewer plugin embeds processed XBRL metadata in the HTML that has a
specific format read by the JavaScript. The metadata produced will work with a
viewer application that has the same major version, and the same or later minor
version as the plugin used to create it.
This means that once an XBRL report has been prepared by the plugin, the
associated JavaScript viewer application can be upgraded within the same major
version. Any features introduced in newer versions of the viewer that rely on
additional metadata will degrade gracefully if that metadata is not present.
## Producing an ixbrl-viewer via the Arelle GUI
### Preparing an iXBRL file via the GUI
1. Open Arelle and select **Manage Plugins** from the **Help** menu.
2. Press **Browse** under "Find plug-in modules".
3. Browse to the **iXBRLViewerPlugin** directory within your checkout of the iXBRL Viewer git repository and select
the **\_\_init\_\_.py** file within it.
4. Press **Close** and then **Yes** when prompted to restart Arelle.
5. You should now have a **Save iXBRL Viewer instance** on the **Tools** menu.
6. Open the ixbrl filing zip in Arelle
7. Select **Save iXBRL Viewer instance** option on the **Tools** menu
8. Provide a **script URL** to the **ixbrlviewer.js** file.
This url can be one of the following:
1. `https://cdn.jsdelivr.net/npm/ixbrl-viewer@/iXBRLViewerPlugin/viewer/dist/ixbrlviewer.js`
2. A relative url to the downloaded ixviewer.js from github
3. A relative url to the locally built ixviewer.js
9. Save the viewer iXBRL file to a new file in the newly created directory by
selecting **Browse**, browsing to the directory, and providing a file name.
10. You should now be able to open the created file in Chrome, and the iXBRL viewer
should load.
### Preparing an iXBRL document set using the Arelle GUI
To prepare an iXBRL document set, open the document set in Arelle. The process
is as for a single file, except that a directory should be selected as the
output location, rather than a file.
## Producing an ixbrl-viewer via the Arelle command line
### Preparing an iXBRL file via the command line
The plugin can also be used on the command line:
```shell
python3 Arelle/arelleCmdLine.py --plugins= -f ixbrl-report.html --save-viewer ixbrl-report-viewer.html --viewer-url https://cdn.jsdelivr.net/npm/ixbrl-viewer@/iXBRLViewerPlugin/viewer/dist/ixbrlviewer.js
```
Notes:
* "Arelle/arelleCmdLine.py" should be the path to your installation of Arelle
* The plugin path needs to an absolute file path to the ixbrl-viewer plugin
* The viewer url can be one of the following:
1. `https://cdn.jsdelivr.net/npm/ixbrl-viewer@/iXBRLViewerPlugin/viewer/dist/ixbrlviewer.js`
2. A relative url to the downloaded ixviewer.js from github
3. A relative url to the locally built ixviewer.js
### Preparing an iXBRL document set
The iXBRL Viewer supports Inline XBRL document sets. This requires the `inlineXbrlDocumentSet` plugin.
The input is specified using JSON in the following form:
```json
[
{
"ixds": [
{ "file": "file1.html" },
{ "file": "file2.html" },
]
}
]
```
The output must be specified as a directory. For example:
```shell
python3 Arelle/arelleCmdLine.py --plugins '/path/to/iXBRLViewerPlugin|inlineXbrlDocumentSet' -f '[{"ixds":[{"file":"document1.html"},{"file":"document2.html"}]}]' --save-viewer out-dir --viewer-url https://cdn.jsdelivr.net/npm/ixbrl-viewer@/iXBRLViewerPlugin/viewer/dist/ixbrlviewer.js
```
Notes:
* The first file specified is the "primary" file, and should be opened in a
browser to use the viewer. The other files will be loaded in separate tabs
within the viewer.
* "Arelle/arelleCmdLine.py" should be the path to your installation of Arelle
* The plugin path needs to an absolute file path to the ixbrl-viewer plugin
* The viewer url can be one of the following:
1. `https://cdn.jsdelivr.net/npm/ixbrl-viewer@/iXBRLViewerPlugin/viewer/dist/ixbrlviewer.js`
2. A relative url to the downloaded ixviewer.js from github
3. A relative url to the locally built ixviewer.js
* Due to browser security restrictions, the resulting viewer cannot be loaded
directly from `file:` URLs; it must be served by a web server.
### Using build-viewer.py
As an alternative to the standard Arelle command line, the
`samples/build-viewer.py` script can also be used. To use the script, both the
Arelle source code and the iXBRLViewerPlugin must be on the Python path. e.g.:
```shell
PYTHONPATH=/path/to/Arelle:/path/to/ixbrl-viewer ./samples/build-viewer.py --help
```
A document set can be processed by passing a directory as input. All `.html`
and `.xhtml` in the directory will be combined into a document set. The
generated files will be saved into the directory specified by the `--out`
option.
Taxonomy packages can be specified using `--package-dir`. All ZIP files in the
specified directories will be loaded as taxonomy packages.
e.g.
```shell
PYTHONPATH=/path/to/Arelle:/path/to/ixbrl-viewer ./samples/build-viewer.py --out out-dir --package-dir /my/packages/ ixds-dir
```
## Stub viewer mode
By default, the link to the JavaScript viewer and the JSON data block are added
to the iXBRL report file (or to the first file, in the case of a document set).
Stub viewer mode is an optional generation mode that creates an additional,
minimal HTML file containing the JSON data block, and the link to the
JavaScript viewer. This mode has two advantages over the default approach of
embedding the JSON data and JavaScript link in the iXBRL report:
1. Provided that all facts and footnotes in the iXBRL report already have ID
attributes, no modification of the iXBRL report is required.
2. The iXBRL viewer loading mask will be displayed much more quickly. This is
helpful for very large iXBRL reports which can otherwise result in a long
delay before there is any sign of the iXBRL Viewer loading.
The downside of this mode is that due to browser security restrictions, the
viewer cannot be loaded directly from files (using `file:` URLs); they must be
served by a web server.
# Optional Features
Some features are disabled by default but can be enabled at generation time or with query parameters.
To enable features:
- Via CLI: `--viewer-feature-{feature name}`
- Via query parameter:`?{feature name}=true`
Features enabled by CLI/JSON can be disabled by query parameter via `?{feature name}=false`.
Note that *any other value* besides "false" (case-sensitive) will *enable* the feature.
This will override any enabling query parameters, so `?review=true&review=false&review=true` would result in the 'review' feature being disabled.
This table uses the 'review' feature as an example to demonstrate how these options interact:
| CLI/JSON | Query Param | Result |
|----------|-------------|------------|
| `unset` | `unset` | `disabled` |
| `unset` | `true` | `enabled` |
| `unset` | `false` | `disabled` |
| `review` | `unset` | `enabled` |
| `review` | `true` | `enabled` |
| `review` | `false` | `disabled` |
## Feature: Review Mode
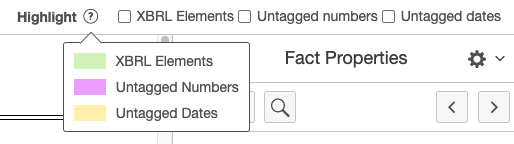
A review mode is available that is intended to assist in reviewing partially tagged or incomplete documents.
This mode replaces the namespace-based highlighting with optional highlighting based on untagged numbers and/or dates.
| CLI/JSON | Query Param |
|---------------------------|----------------|
| `--viewer-feature-review` | `?review=true` |
# Disable viewer loading
Loading of the viewer can be disabled by specifying `?disable-viewer` as a
query parameter. This will leave the iXBRL document loaded in the browser, but
without any viewer functionality. In the case of an iXBRL document set, or
multi-document viewer, the first document will be shown.
## Running tests
### Running unit tests
In order to run the javascript unit tests make sure that you have installed all of the npm requirements.
Run the following command to run javascript unit tests: `npm run test`
In order to run the python unit tests make sure that you have pip installed requirements-dev.txt.
Run the following command to run python unit tests: `pytest tests/unit_tests`
### Running Puppeteer tests
All commands should be run from repository root
1. Install the npm requirements(instructions under [Building the javascript locally](#building-the-javascript-locally)).
2. Install Arelle
```shell
pip install .[arelle]
```
3. [Terminal 1] Start the puppeteer serve
```shell
npm run puppeteerServe
```
* This command generates the `ixbrlviewer.js`, uses Arelle to generate several test files, then serves the files via a nodejs http-server.
* Currently changes to application code require restarting this step to take effect.
4. Start the puppeteer tests
* [Terminal 2]:
```shell
npm run test:puppeteer
```
* IDE:
* Many of the IDE's on the market can run tests via the UI. The following is an example configuration for intellij. Once set you can right-click on the test name or file and select the run option.
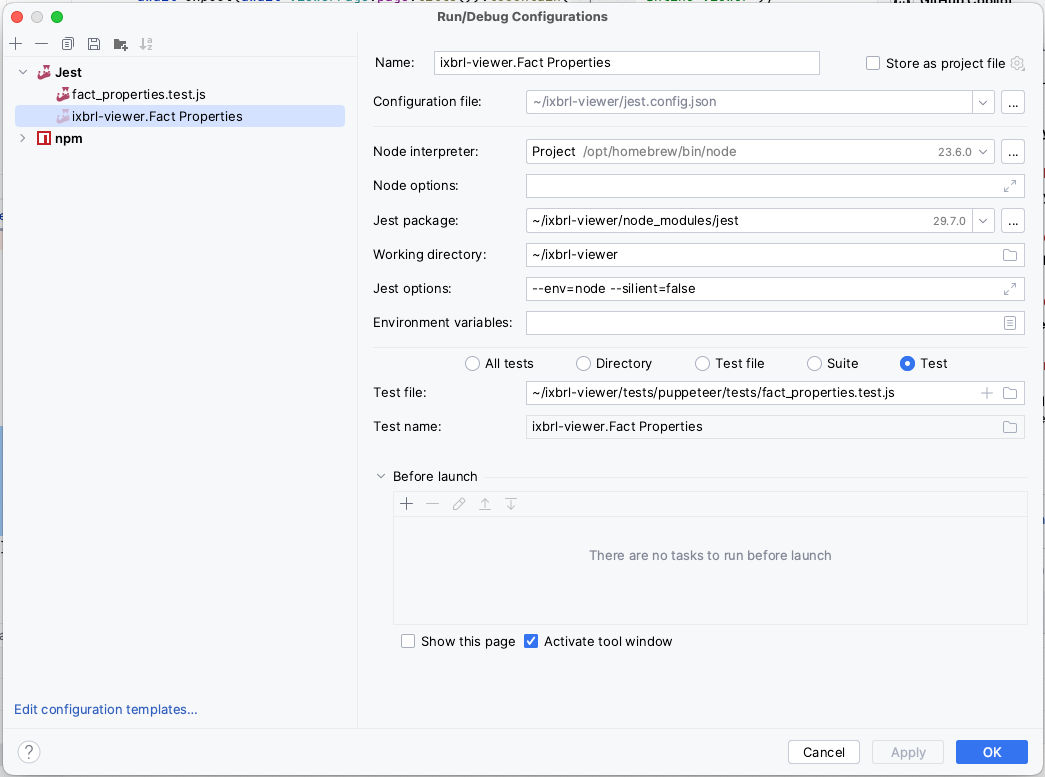
* Debug runs with breakpoints are also typically supported.
��������������������������������������������������������������������������������������������������������������������������������������������������././@PaxHeader��������������������������������������������������������������������������������������0000000�0000000�0000000�00000000026�00000000000�010213� x����������������������������������������������������������������������������������������������������ustar�00�������������������������������������������������������������������������������������������������������������������������������������������������������������������������������������������������������������������������������������������������������22 mtime=1711671226.0
����������������������������������������������������������������������������������������������������������������������������������������������������������������������������������������������������������������������������������������������������������������������������������������������������������������������������������������������������������������������������������������������������������������������������������������������������������������������������������������������������������ixbrl-viewer-1.4.22/PLUGINS.md����������������������������������������������������������������������0000644�0001751�0000177�00000002517�14601403672�015277� 0����������������������������������������������������������������������������������������������������ustar�00runner��������������������������docker�����������������������������������������������������������������������������������������������������������������������������������������������������������������������������������������������������������������# Plugins
The iXBRL Viewer provides a simple plugin framework, to enable projects to
build JavaScript iXBRL viewers with additional functionality.
A plugin is a class with one or more of the following methods:
* `extendDisplayOptionsMenu(menu)` - provides a menu object that can be modified to add additional options.
* `preProcessiXBRL(body, docIndex)` - called once with the `` DOM node for each document in the document set.
* `updateViewerStyleElements(styleElts)` - called on initialization with a jQuery object containing the `